
| Luís Abel da Silva Filho1; Francisco Ebeth Mascarenhas de Lima2. |
| 1 - Professor Adjunto do Departamento de Economia da Universidade Regional do Cariri - URCA |
| 2 - Economista pela Universidade Regional do Cariri - URCA. |
Abstract
The trade of oil and oil products in the world is markedly of high magnitude, since that input is a major source of energy, and, even more, represents political, financial and social power, and is one of the raw materials of paramount importance in industrial production. Such importance was proven in the 1970s, before the crisis, generating serious consequences on the world stage. The objective of this study is to analyze, in a preliminary way, the relations of the oil trade between Brazil and the countries of Organization of Petroleum Exporting Countries - OPEC. Methodologically, it resorts to a literature review and then to the construction of foreign trade indexes, including: indicator ’exports, import dependence indicator, Verdoorn index, relative specialization index, trade specialization index and regional orientation index. To test these indexes were used the products of the Chapter 27 of the classification table of Mercosur - NCM, all are petroleum based. After the analysis, we realized the great dependence of Brazil in relation to imports of these products and the low export capacity for OPEC, demonstrating that the country still depends greatly on imports of OPEC products, and that this organization does not is a large Brazilian trading partner in the sector in question.
Keywords: Trade relations; Oil; Brazil-OPEC.
JEL: F00; F1; F4.
1. Initial Considerations
The oil trade has significant support in trade relations worldwide. It is extremely relevant for the production of several fundamental sectors in the countries, developed or developing. Thus, we can highlight sectors, such as transportation and industrial, which depend sharply of this input for its operation. However, this reputation is not limited only to economic, but also social and political factors. This highlights the great dependence of this input of many countries around the world (Aragon, 2005).
In the 1970s there were two events that showed that high dependence of the countries, including Brazil. There were the so-called oil shocks of 1973 and 1979, which had negative effects on production and implemented high inflation climbing worldwide (Giambiagi, 2005). In 1973, with the first shock, the industrialized countries soon increased the interest rate, compromising the ability to import from developing countries (Giambiagi, 2005; Carneiro, 2002). In Brazil there has been successive trade deficits. In the second shock, the reduction of on lending of capital of industrialized countries to developing countries was more intense, due to the rise of international interest rates. Higher intensity than in the first shock, the fact has further aggravated the situation of indebted countries, case of Brazil (Giambiagi, 2005).
Moreover, after the oil shock in 1979, the inflation indicators rise again. From there, the issuance of public debt becomes increasingly routine in the market. To cover the reduction of international liquidity, the issue was intensified a frightening magnitude (Carneiro, 2002). The government sought a new way to fund state-owned enterprises (among them Petrobras), starting thus a markedly high internationalization of the Brazilian economy (Goncalves. 1999; Soares et al.. 2013).
After the shocks, several initiatives have been taken by countries dependent on oil, emphasizing the need to increase the domestic production and the production of renewable energy. In the 1990s, the oil industry advances in innovation and production. Petrobras seeks oil exploration in deep and extremist deep waters , through research and development of new technologies in the sector. In that decade, there is also the flexibility of the oil monopoly, which now rely on private companies and therefore, eliminated the state monopoly on the product extraction. However, oil GDP, from 1990 to 2003, growing 141% and the aggregated value of Petrobras grows 225% in the same period (Aragon, 2005).
In the international trade in oil and oil products, intensify the relations between exporting countries. It appears new areas of exploration, as well as improving the technology used in existing areas. In addition, the Brazilian production increased considerably, as well as its international participation in global trade of the products in question.
It is therefore in this context, that the study aims to analyze, from a preliminary approach, the trade relations between Brazil and OPEC, limited here to analyze this economic bloc, given the hegemony of the same in world trade in oil. For this, you will use a range of indicators that enable an analysis of this relationship, showing whether or not dependency occurs in trade relations between the studied entities.
To achieve the proposed objective will be used data analysis system of the Foreign Trade Information Internet (ALICE-WEB), the Secretariat of Foreign Trade (SECEX) of the Ministry of Development, Industry and Foreign Trade (MDIC), related the years 1997 to 2012. It is therefore necessary to build international trade indicators, from the work proposed.
The paper is structured as follows: in addition to the initial considerations, the second section discusses the methodological procedures used here; in the third section, builds the indexes of trade relations; and, finally, in the fourth section, weaves the final considerations.
2. Methodological Procedures
This section will deal with the methodological procedures used in this article. Such procedures are of great relevance for the understanding and analysis of results. Here, the types of data used, and the calculation of international trade indicators will be presented, taking into account exports and imports from Brazil of oil and oil products, from 1997 to 2012, and its trade relations with OPEC, in this sector.
In this context, the study refers to a secondary database, coming from the Foreign Trade Via Internet Analysis System (ALICE-WEB) and the Ministry of Development, Industry and Trade (MDIC). From the database were collected information of exports and imports from Brazil in relation to the rest of the world, and also in relation to trade between Brazil and the Organization of Petroleum Exporting Countries (OPEC), the central focus of the analysis.
Thus, it is possible to observe the behavior of trade relations between Brazil and OPEC. Considering that the dependence of Brazil in some oil products in recent years has been increasing. There have been analyzed a basket of products encoded by the Southern Common Nomenclature table (NCM). Such products which are part of this group are listed in Chapter 27 of the NCM table, and contain as the title compound the oil. Therefore, the used products are classified in the following way: coal gas, water, etc.; oil extract/hydrocarbon gases, liquefied petroleum gas (LPG), natural gas in gaseous state, natural gas, liquefied, “diesel” (diesel) and gasoline of aviation.
The quantitative information on imports and exports of the products used to support the analytical instruments used in research.
As for international trade indicators, we used the dependency coefficient of imports, exports indicator, Verdoorn index, trade specialization index, specialization index relative and regional orientation coefficient. These indices allow us to observe the behavior of trade relations between the countries involved, about the products under observation.
The construction of the indicator takes place in the following manner:
2.1 Import Dependency coefficient
\[\begin{equation} DM = \left( | \frac{M_{t}}{PIB_{t}} | \right) \tag{1} \end{equation}\]
where, \(DM\) Corresponds to import dependence coefficient; \(M_{t}\) Corresponds to imports of the country in the period \(t\); \(PIB_{t}\) Corresponds to the country’s GDP in the period \(t\).
This index measures the dependence of the country’s imports over the years according to the GDP of the corresponding year. For this indicator, the higher the level of dependence on imports, the lower is the level of production capacity and supply to the country and, consequently, higher expenditure on purchase of products abroad.
2.2 Exporter Effort Indicator
\[\begin{equation} IEX = \left( | \frac{X_{t}}{PIB_{t}} | \right) \tag{2} \end{equation}\]
where, \(IEX\) Corresponds to the export effort indicator; \(X_{t}\) Corresponds to exports in the period \(t\); \(PIB_{t}\) Corresponds to the country’s GDP in the period \(t\).
This indicator is a very simple way to measure the degree of openness of the economy and points to the part of the national product for export. The higher the value of the indicator, the higher the country’s ability to produce for the export market and, consequently, is reflected in the performance of the trade balance.
2.3 Verdoorn Index
\[\begin{equation} V = \left( | \frac{X_{i,t}}{M_{i,t}} | \right) \tag{3} \end{equation}\]
Where, \(V\) Verdoorn Index; \(X_{i,t}\) and \(M_{i,t}\) represent, respectively, exports and imports of a country in a given sector “\(i\)” in a given period of time “\(t\)”.
The value of the indicator takes the following propositions, namely: ranges from zero (when the country does not export the product concerned) to infinity (when the country exports very little of the product, but the matter in considerable quantities). In this sense, the index shows the extent of trade between the countries under review.
2.4 Commercial Specialization Index
\[\begin{equation} EC = \left[ \frac{|X_{i,j} - M_{i,j}|}{|\left( M_{i,j} + M_{i,j} \right)|} \right] \tag{4} \end{equation}\]
Where, \(EC\) Commercial Expertise Index; \(X_{i,t}\) and \(M_{i,t}\) represent, respectively, exports and imports, in a sector “\(i\)” in a country “\(j\)” a given period.
Also called “Balassa Index”, it is applied in a certain sector of the national economy and ranges from 0 to 1 ($ 0 < EC < 1$). The maximum value of 1 means that one of the terms is zero, that is, so that the value is 1 the country only imports or exports only products on the desired area. Thus, the country has no degree of integration with similar sectors in other countries.
2.5 Relative Specialization Index
\[\begin{equation} ER = \left[ \frac{\left( \frac{X_{pit}}{X_{pt}} \right)}{| \left( \frac{ X_{zit}}{X_{zt}} \right)|} \right] \tag{5} \end{equation}\]
Where, \(ER\) Relative Specialization Index; \(X_{pit}\) Export from country “\(p\)”, of the sector “\(i\)”, in the year “\(t\)”; \(X_{pt}\) Total exports of the country “\(p\)”, in the year “\(t\)”; \(X_{zit}\) Area of export “\(z\)”, from the sector “\(i\)”, in the year “\(t\)”; \(X_{zt}\) Total exports of the area “\(z\)”, in the year “\(t\)”.
This index is applied in certain sectors of the economy in the context of integrated zone. If >1 the country has considerable level of expertise in a given sector, compared with the integrated zone.
2.6 Coefficient of Regional Guidance - COR
\[\begin{equation} COR = \left[ \left( \frac{\frac{X_{ij}}{X_{tj}}}{\frac{ X_{tix}}{X_{txj}}} \right) \right] \tag{6} \end{equation}\]
Where, \(X_{ij}\) Exports of the country \(i\) of certain commodity in the sector \(i\), intra-bloc; \(X_{tj}\) Total exports of the country \(i\) intra-bloc; \(X_{tix}\) Total value of exports of a given commodity sector, \(i\), extrabloc; \(X_{txj}\) Total value of extra-bloc exports.
It is a very important index, obtained by reason of the share of exports of a product on the total exports of the country for a particular country or economic bloc, by the share of exports in total exports of the product extra block. It should be observed over time, ranging between zero and infinity, wherein: if the value is equal to the unit tend to export into and out of the block; if over time is growing, trend is to export intra block: and, if declining, the trend is to export out of the block3.
Based on these indexes, it is possible to observe the behavior in Brazilian trade relations with the world and with OPEC in the specified sector. This makes it therefore possible to quantify trade relations and their impact on the trade balance.
3. Statistics of international trade between Brazil and OPEC
3.1 Growth rate of imports, exports and leftover in the trade balance.
It is appropriate to analyze the total value of exports of the products studied, that is, the value of all that Brazil exported of the Cap. 27 of the NCM table. Therefore, Brazilian exports of these products have considerable value, and in 1997 they start at a value of approximately $ 24 million and from 2009 followed an upward trend, reaching its peak in 2011, with records approximately $ 20 billion. As regards the percentage variation may be observed in Figure 1the values between 1998 to 2012.
Graph 01 - Total variation of Brazilian Exports Cap 27 (Table NCM).
Source: Prepared by the authors based on the data from AliceWeb-MDIC, 2014.
As indicated in the records, in 2000 there is a large increase in the value of exported percentage, in fact in this period, according to Alice Web data, export values amount to 17 million in 1999 to approximately 176 million in the next year, which confers this variation over 900%. In subsequent years the exported percentage continues to grow, but in smaller proportions, with a fall from 2008 to 2009, as the world economy was experiencing a great magnitude of crisis. In those years exports fell from 13 billion in 2008 to 9 billion in 2009, namely a decrease of approximately 31%. In the following years they grow back reaching its peak in 2011.
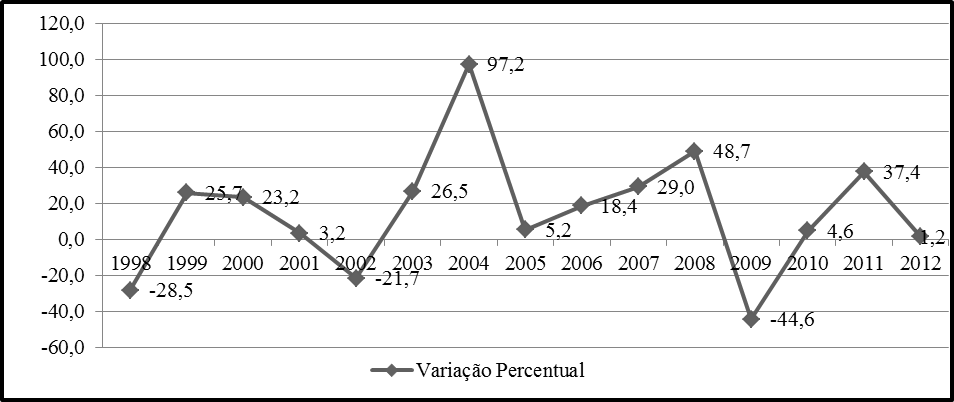
In relation to Brazilian imports, considering the Cap. 27 products, it is noticed that from the beginning they have good high. In 1997, for example, they already accounted for 4 billion of expenditure of Brazilian export income. They grow back from 2002 and reach the top in 2008 with about 16 billion. After that, in 2009 there is a decrease in imports to around 9 billion, and a growth trajectory in subsequent years. The graph 02, shows relatively, the variation of Brazilian imports of products Cap.27 NCM table for the years 1998-2012.
Graph 02 - Total variation of Brazilian Imports Cap 27 (Table NCM).
Source: Prepared by the authors based on the data from AliceWeb-MDIC, 2014.
According to the records plotted in the chart, from 2002 the value of Brazilian imports grows back continuously. Registers itself for consequent positive percentage change. The upward trend remains up to the year 2008. In 2009, it falls approximately 44% in relative values, but soon reverts to positive growth rates.
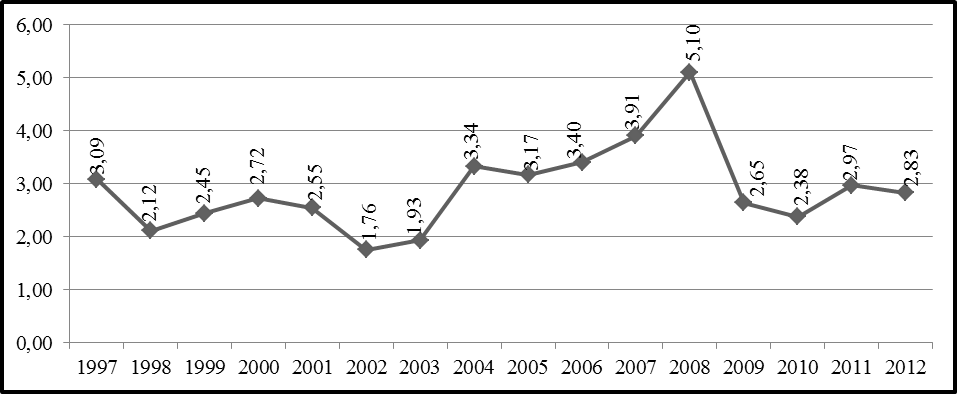
In its turn, trade between Brazil and OPEC over the years stands out becoming ascending and descending upon the actions of international trade policies and changes in the global macroeconomic scenario. The crisis has led to sharp reduction in world economic relations, not leaving untouched the Brazilian relations in international trade. In the process of trade relations with OPEC, it is observed between 1998 and 2000, modest variation in growth rates of exports of oil products, with a pretty sharp boom in 2001. Since 2001, Brazil continues with considerable growth rates, but lower and considerable variations over the years.
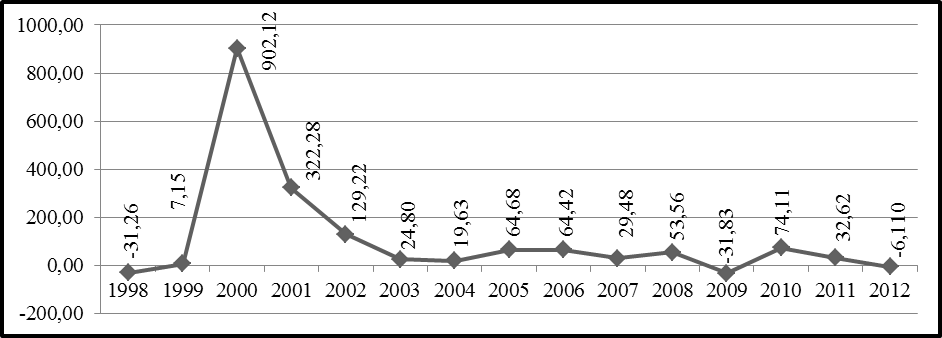
Graph 03 - Percentage Variation of Brazilian exports to OPEC Period, 1998-2012.
Source: Prepared by the authors based on the data from AliceWeb-MDIC, 2014.
The global economic scenario introduced from 2001 was favorable to the increase of trade relations worldwide. Brazil was certainly benefited in the process, bearing considerable increase in their exports and thereby improving their performance markedly in its trade balance. With regard to the specific product studied, the plotted data show that in all analyzed serious change was positive.
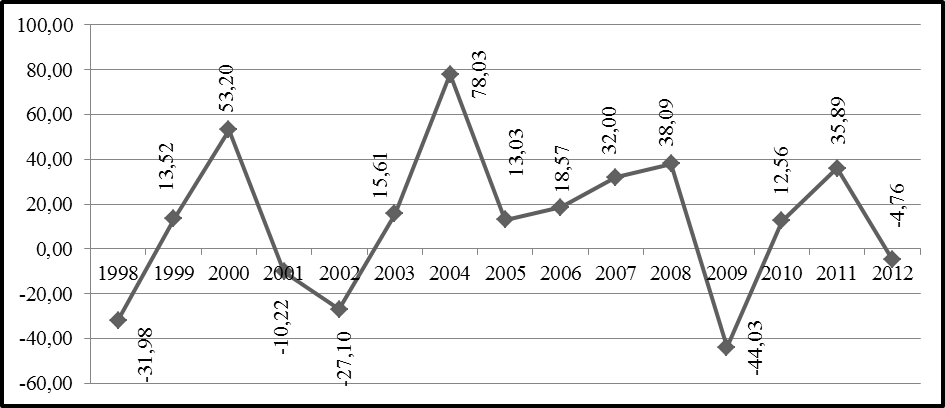
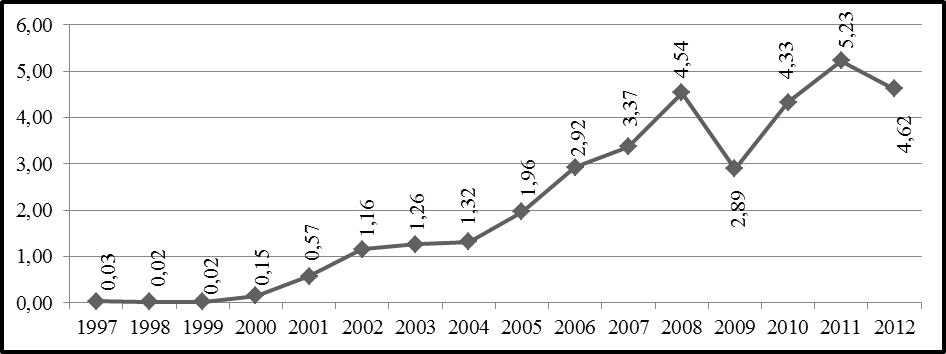
As pertains to the change in imports of oil and oil products, as can be seen in Figure 4, they occur with increased intensity, unlike what happened with exports (Chart 3). In 1998 and 2002 exports had negative variations with increasing trends, however modest, in the other years. Furthermore, the variation was markedly uneven over the years. The greatest variation in imports was recorded in 2004 (97%).
Graph 04 - Percentage Variation of Brazilian Imports from OPEC in the period 1998-2012.
Source: Prepared by the authors based on the data from AliceWeb-MDIC, 2014.
As can be seen in the chart, 2009 recorded the largest negative change of the series as a result the answer given by the crisis of 2008. It reduces therefore, Brazilian imports of oil and oil coming from OPEC in the international crisis context . Moreover, it is worth noting that the variations of imports were therefore exceedingly modest in relation to imports, because, especially of the less dependence on imported oil.
When analyzing the data jointly it realizes that Brazil is a major importer of OPEC products, all that Brazil imports of Cap. 27, in most years, about 70% of imports is only of that bloc. Nevertheless, there is no reciprocity in trade relations with the products in question. That is, everything that the country exports to the world, the percentage exported only to OPEC, in most years, not less than 1%. These values are shown in table 1 below.
Table 1 - Percentage of imports/exports to OPEC in relation to total imports/Brazilian exports (Cap. 27) 1997-2012.
| Year | Imports percentage only OPEC in relation to total imports | Export percentage only OPEC in relation to total exports |
|---|---|---|
| 1997 | 67.79 | 0.007 |
| 1998 | 71.27 | 0 |
| 1999 | 78.93 | 0.027 |
| 2000 | 63.49 | 0.002 |
| 2001 | 72.99 | 15.034 |
| 2002 | 78.38 | 17.610 |
| 2003 | 85.76 | 6.329 |
| 2004 | 95.00 | 3.33 |
| 2005 | 88.41 | 0.0008 |
| 2006 | 88.27 | 0.010 |
| 2007 | 86.27 | 0.013 |
| 2008 | 92.89 | 0.017 |
| 2009 | 92.00 | 0.010 |
| 2010 | 85.49 | 0.0002 |
| 2011 | 86.42 | 0.001 |
| 2012 | 91.86 | 0.004 |
Source: Prepared by the authors based on the data from AliceWeb-MDIC, 2014.
What can be seen from the data plotted in Table 1, is that there are trade relations between Brazil and OPEC, with regard to the products of NCM table, chapter 27. However, there is a markedly high dependency of Brazil in relation to block analysis. It is seen, therefore, that, in every year, the percentage is markedly higher than 50.0% of trade relations with the observed products. In some years, records show to be more than 90.0%. On the other hand, Brazilian exports of such products for this unit is significantly reduced, as can be seen in the table.
3.2 International Trade indicators between Brazil and OPEC
As evidenced in Aragon (2005), from 1990 to 1997, it occurs a large increase in research and technology development in the Brazilian oil industry. In 1997, it was published the Law 9478/9, thanks to it the Brazilian oil exploration market was reopened to the private sector both locally and externally. According to Figure 5, it is noticed that, from the year 1997, there is a fall in the import dependency ratio, which extends to the year 2004. Thus, these investments in research and technology were very beneficial for the Brazilian oil industry. Moreover, it is appropriate to emphasize that exchange rate changes, leaving these of fixed to floating since 1999, have their contribution in this respect.
Graph 05 - Brazil — dependence coefficient on oil imports. Cap 27 table NCM —. 1997-2012.
Source: Prepared by the authors based on the data from AliceWeb-MDIC, 2014.
Since 2004, it amounts to Brazilian dependence on imported oil, reaching a peak in the year 2008. In this context, evidenced by Barbosa (2013), after 2006, there is an increase in the price of international oil barrel; Furthermore, Brazil is going to need oil imports to be combined with domestic oil, as the Brazilian oil has a heavier composition than the combination most commonly used in refineries. From 2008 onwards, it reduces the dependency on imported crude product basis, since it was a better adaptation to the type of oil refineries produced in the country.
However, you can also assign the height of the dependence on imports to a very important factor. In Brazil, the main type of transport is the road and the demand for diesel oil accounts to 40% of all demand for petroleum products (BARBOSA, 2013). In this context, the demand for diesel or diesel oil was and still is very high, since it has not yet adapted the total production of this important derived of country’s demand.
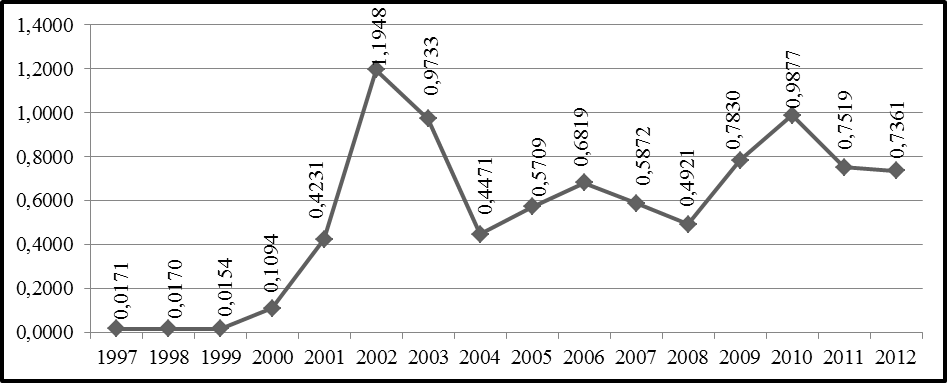
The following index, seen in graph 06, says the export effort of the country, for the products studied here. It is noticed that Brazil has a low rate of export effort in the initial years, setting that it practically does not export any of the objects of this research products. However, over the years, this index grows back in a show of that Brazilian exports in this sector are progressing; reaching its peak in 2011, when the total Brazilian exports of these products was considerable.
Graph 06 - Exports Indicator: Brazil - 1997-2012.
Source: Prepared by the authors based on the data from AliceWeb-MDIC, 2014.
As can be seen in Figure 6, only the years 1997 to 2001 registered little expressive values of the coefficient. The total exports of the product grow back, indicating that the country has been improving in their marketing with the rest of the world; But in relation to exports to OPEC, the value is very small, considering that this organization is specialized in the production of petroleum-based products, which demonstrates not be the OPEC an important Brazilian trade partner, especially as regards the purchase of oil produced in the country.
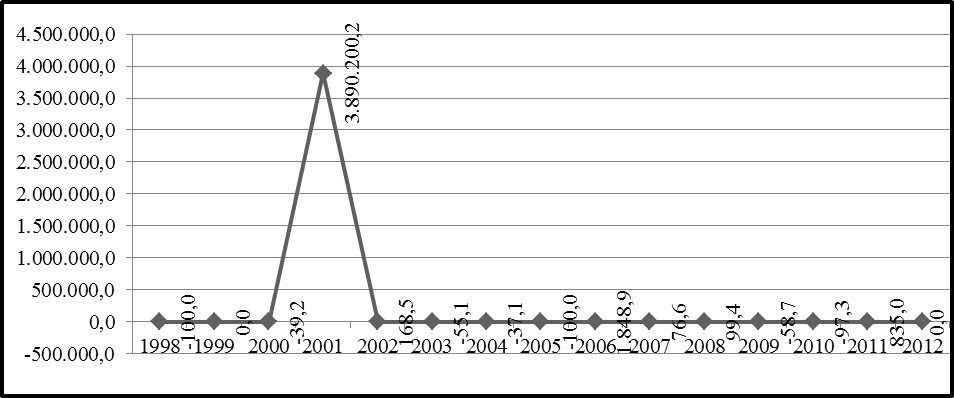
3.3 Verdoorn Index
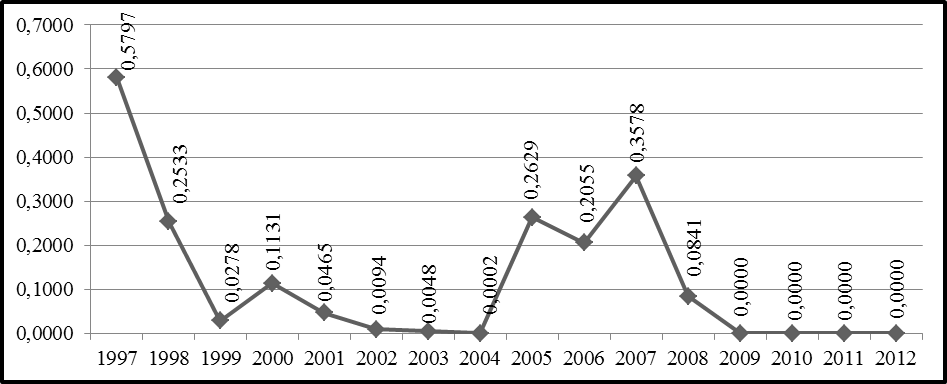
This index is very important for the study. It can prove the total dependence of the country of the studied products, since the closer to zero, the country exports very little of the studied product. The more the index distances itself, we have an indication that the country exports and imports little in larger proportions. Thus, as seen from Figure 7.
Graph 07 - Verdoorn Index — Brazil and OPEC — 1997-2012.
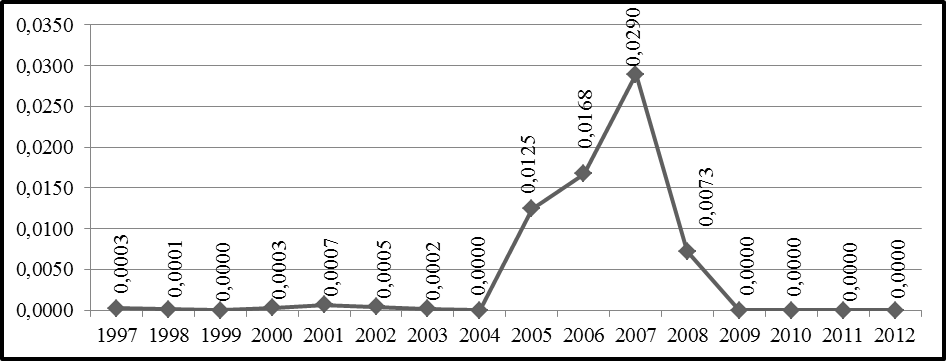
Source: Prepared by the authors based on the data from AliceWeb-MDIC, 2014.
Brazil does not export to OPEC in derivatives considerable proportions of utilized oils, showing its total dependence on products. From the year 2004, the country starts importing more products peaking in 2007, when according to Alice Web data, Brazil imported more than 10 billion OPEC and exported just over 300,000. It is configured that between 2004 and 2007, there is a good trade between Brazil and OPEC, despite the extreme difference between imports and exports.
3.4 Commercial Specialization Index
This index shows the trade specialization of Brazil with OPEC. It is able to show whether Brazil is specialized in marketing of items of NCM table, sometimes used in this study, since the index must be within the interval between zero and 1, to occur integration with OPEC. Thus, if the value is 1 the country only imports or exports only products in the study sector. So, follow the chart information 8, where there is the evolution of the index during the years studied.
Graph 08 - Specialization Index Brazil Commercial and OPEC - 1997-2012.
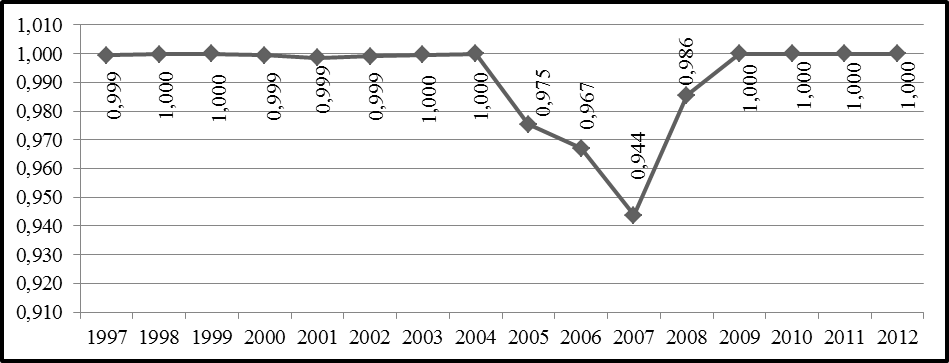
Source: Prepared by the authors based on the data from AliceWeb-MDIC, 2014.
It is clear, therefore, to the analyze the graph 8, Brazil, over the years, the indicator remains close to the unit. It can be considered that the country exports in minimum proportions products and imports from OPEC in markedly elevated quantities.
3.5 Relative Specialization Index
It is used this index to certain sectors of the economy, whose value must be greater than one so you can record performance in the sector under observation. In this case, it follows that the country specializes in a certain sector compared to the integrated zone. Thus, as the graph data 9, it is possible significant changes over the years.
Graph 09 - Relative specialization index - Brazil and OPEC - 1997-2012.
Source: Prepared by the authors based on the data from AliceWeb-MDIC, 2014.
According to the results plotted in Chart 9, in every year, we see that Brazil is not specialized in the export of the product; however, in 2002 it is recorded the best result in the country, the relative specialization of the screen sector. That is, in 2002, exports of goods to the rest of the world were quite relevant when compared with the total of Brazilian exports and total imports of OPEC. The total exports of dollars were almost two billion, approaching quite of the total imported from OPEC (MDIC, 2012).
3.5 Regional Orientation Index
This index evaluates the Brazilian ability to insert their products in a particular block. In this study, the construction of the indicator has a central core of the OPEC member countries. The index therefore indicates the direction that took the exports over the period studied. As can attest the results of the chart 10, the country loses participation in international trade of the products studied in relation to OPEC countries.
Graph 10 - Regional Orientation Index - Brazil and OPEC - 1997-2012.
Source: Prepared by the authors based on the data from AliceWeb-MDIC, 2014.
In this sense, we can see there is a poor input of petroleum products in the economic bloc, because the values are very close to zero. Moreover, it is worth noting the fact that the OPEC countries are producing and exporting oil products makes them great experts in the industry. Thus, factors such as lower production costs can have a strong influence on the result of world trade. However, it highlights that, from 2004, an export elevation occurs which reaches its apex in 2007, with little more than $ 300 million. The period 2004-2007 was the period of better trade between Brazil and OPEC.
4. Final consideration
The aim of this paper was to analyze the Brazil-OPEC international trade between 1997 and 2012, considering the products of Chapter 27 of the NCM table. The results show Brazil’s dependence on trade with products of Chapter, and this markedly elevated in most years in question.
In International trade, it is noticed that Brazil at the beginning (1997) exported little of the products studied, but over the years the situation has changed and the country is increasingly enhancing their ability to export to the world. From the beginning, it already imported considerable magnitude, but in relation to trade with OPEC, you realize that Brazil is a big importer of the products studied, and export them in a few proportions, since the OPEC member countries are specialized in marketing of these inputs.
In fact, in almost all years studied, more than 70% of total imports from Brazil only came from OPEC. Furthermore, in almost all these years, less than 1% of the total that Brazil exported was to OPEC, revealing the dependence on imports of this block, evidencing not be our country a great trading partner, especially regarding with sales of the product under consideration for the block.
It is appropriate to note, however, that, between the years 2005 to 2008, Brazil has better performance in trade relations with OPEC, but the trade deficit does not stop to exist, only decreases after 2008, when he fell from US $ 15 billion to just more than $ 8 billion, a decrease attributed to the troubled period that lived the world economy.
For indicators, one can see that Brazil is completely dependent on imports of oil from OPEC, given that commodity represents considerable volume in Brazilian exports to the rest of the world, but in relation to OPEC exports virtually negligible values. This was evidenced in the export effort indicator. In addition, the volume of imports of these products studied in NCM table is very high, indicating a high degree of dependence on imports of these products from OPEC.
The Verdoorn index, Commercial Specialization Index, Relative Specialization Index point on the fact that Brazil depends on imports of OPEC. Our country imports in significant quantities, compared to OPEC has no specialization in marketing. Exports to this block are few, proving the non-existence of trade partnership between them.
Therefore, it is important to note that Brazil, yes, has evolved in exports of products Cap. 27 of the NCM table, but on OPEC there is the low penetration of Brazilian products into this block (a fact that can be noticed with the Regional Orientation Index) and the imported volume of this organization is very considerable. In some years is more than 90% of total Brazilian imports. Thus, it is evident that Brazil and OPEC are not major trading partners, and that Brazil depends on imports of these products, originating mainly from OPEC.
5. Bibliography
ARAGÁO, A. P. Estimativa da contribuição do setor petróleo ao produto interno bruto brasileiro: 1955/2004. Disponível em: http://www.ppe.ufrj.br/ppe/production/tesis/amandap.pdf acesso em 22 abril 2014.
BADO, A. L. Das vantagens comparativas à construção das vantagens competitivas: uma resenha das teorias que explicam o comércio internacional. Revista de Economia & Relações Internacionais, São Paulo, v. 3, n. 5, p. 5-20. 2004. Disponível em: http://mirror.faap.br/revista_faap/rel_internacionais/pdf/economia_05.pdf#page=5 Acesso em 22 abril 2014.
BARBOSA, Paula. O endividamento da Petrobras com o BNDES no período pós-2008 e impactos contábeis e econômico-financeiros. Disponível em: http://portalibre.fgv.br/lumis/portal/file/fileDownload.jsp?fileId=8A7C82C54268EC3B014294E6F6CB5C68 acesso em 22 abril 2014.
CARNEIRO, R.. Desenvolvimento em crise: a economia brasileira no ultimo quarto do século XX. São Paulo: editora Unesp, IE – Unicamp, 2002.
Díaz Mora (2001). El Impacto Comercial de laIntegración Económica Europea. Periodo 1985-1996. Madrid, Consejo Económico y Social, 314 p. (ColecciónEstudios, 114).
GIAMBIAGI, F. et al. Economia Brasileira Contemporânea. Rio de Janeiro: Campus, 2005.
GONÇALVES, R.. Globalização e desnacionalização. São Paulo, Paz e Terra, 1999, 237 p.
Lobejón Herrero (2001). El Comercio Internacional. Madrid, AKAL, 164 p.
RICARDO, David. Princípios de Economia Política e Tributação. São Paulo: Nova Cultural ltda., 1996.
SOARES, P. M. et al. A indústria de petróleo no Brasil: avaliação histórica da concepção da empresa Petrobrás. Disponível em: http://www.centropaulasouza.sp.gov.br/pos-graduacao/workshop-de-pos-graduacao-e-pesquisa/008-workshop-2013/trabalhos/otimizacao_e_qualidades_de_sistemas_produtivos/121947_942_952_FINAL.pdf 22 abril 2014> acesso em: 22 abril 2014.
SOUZA, M. J. P. de; ILHA, A. da S. Índices de vantagem comparativa revelada e de orientação regional para alguns produtos do agronegócio brasileiro no período de 1992 a 2002. Disponível em: http://coral.ufsm.br/mila/adayr/publicacoes/cientificos/vantagemcomparativa.pdf acesso em: 22 abril de 2014.
Notas de Rodapé